
A size chart is a prediction about your customer's body that was never tested against your actual customers. It's built from a fit model's proportions and a set of grading rules, then published long before real shoppers interact with the product. That's why fit-related returns stay high no matter how carefully you write the numbers. The fix isn't a better guess - it's a size chart that rebuilds itself from the measurements of the customers who ordered and kept each size.
Over the last few years building sizing technology for apparel brands, one thing has become pretty clear: most size charts are built using the best information available at the time, but they’re still based on assumptions about who the customer is and how they’ll fit into a garment.
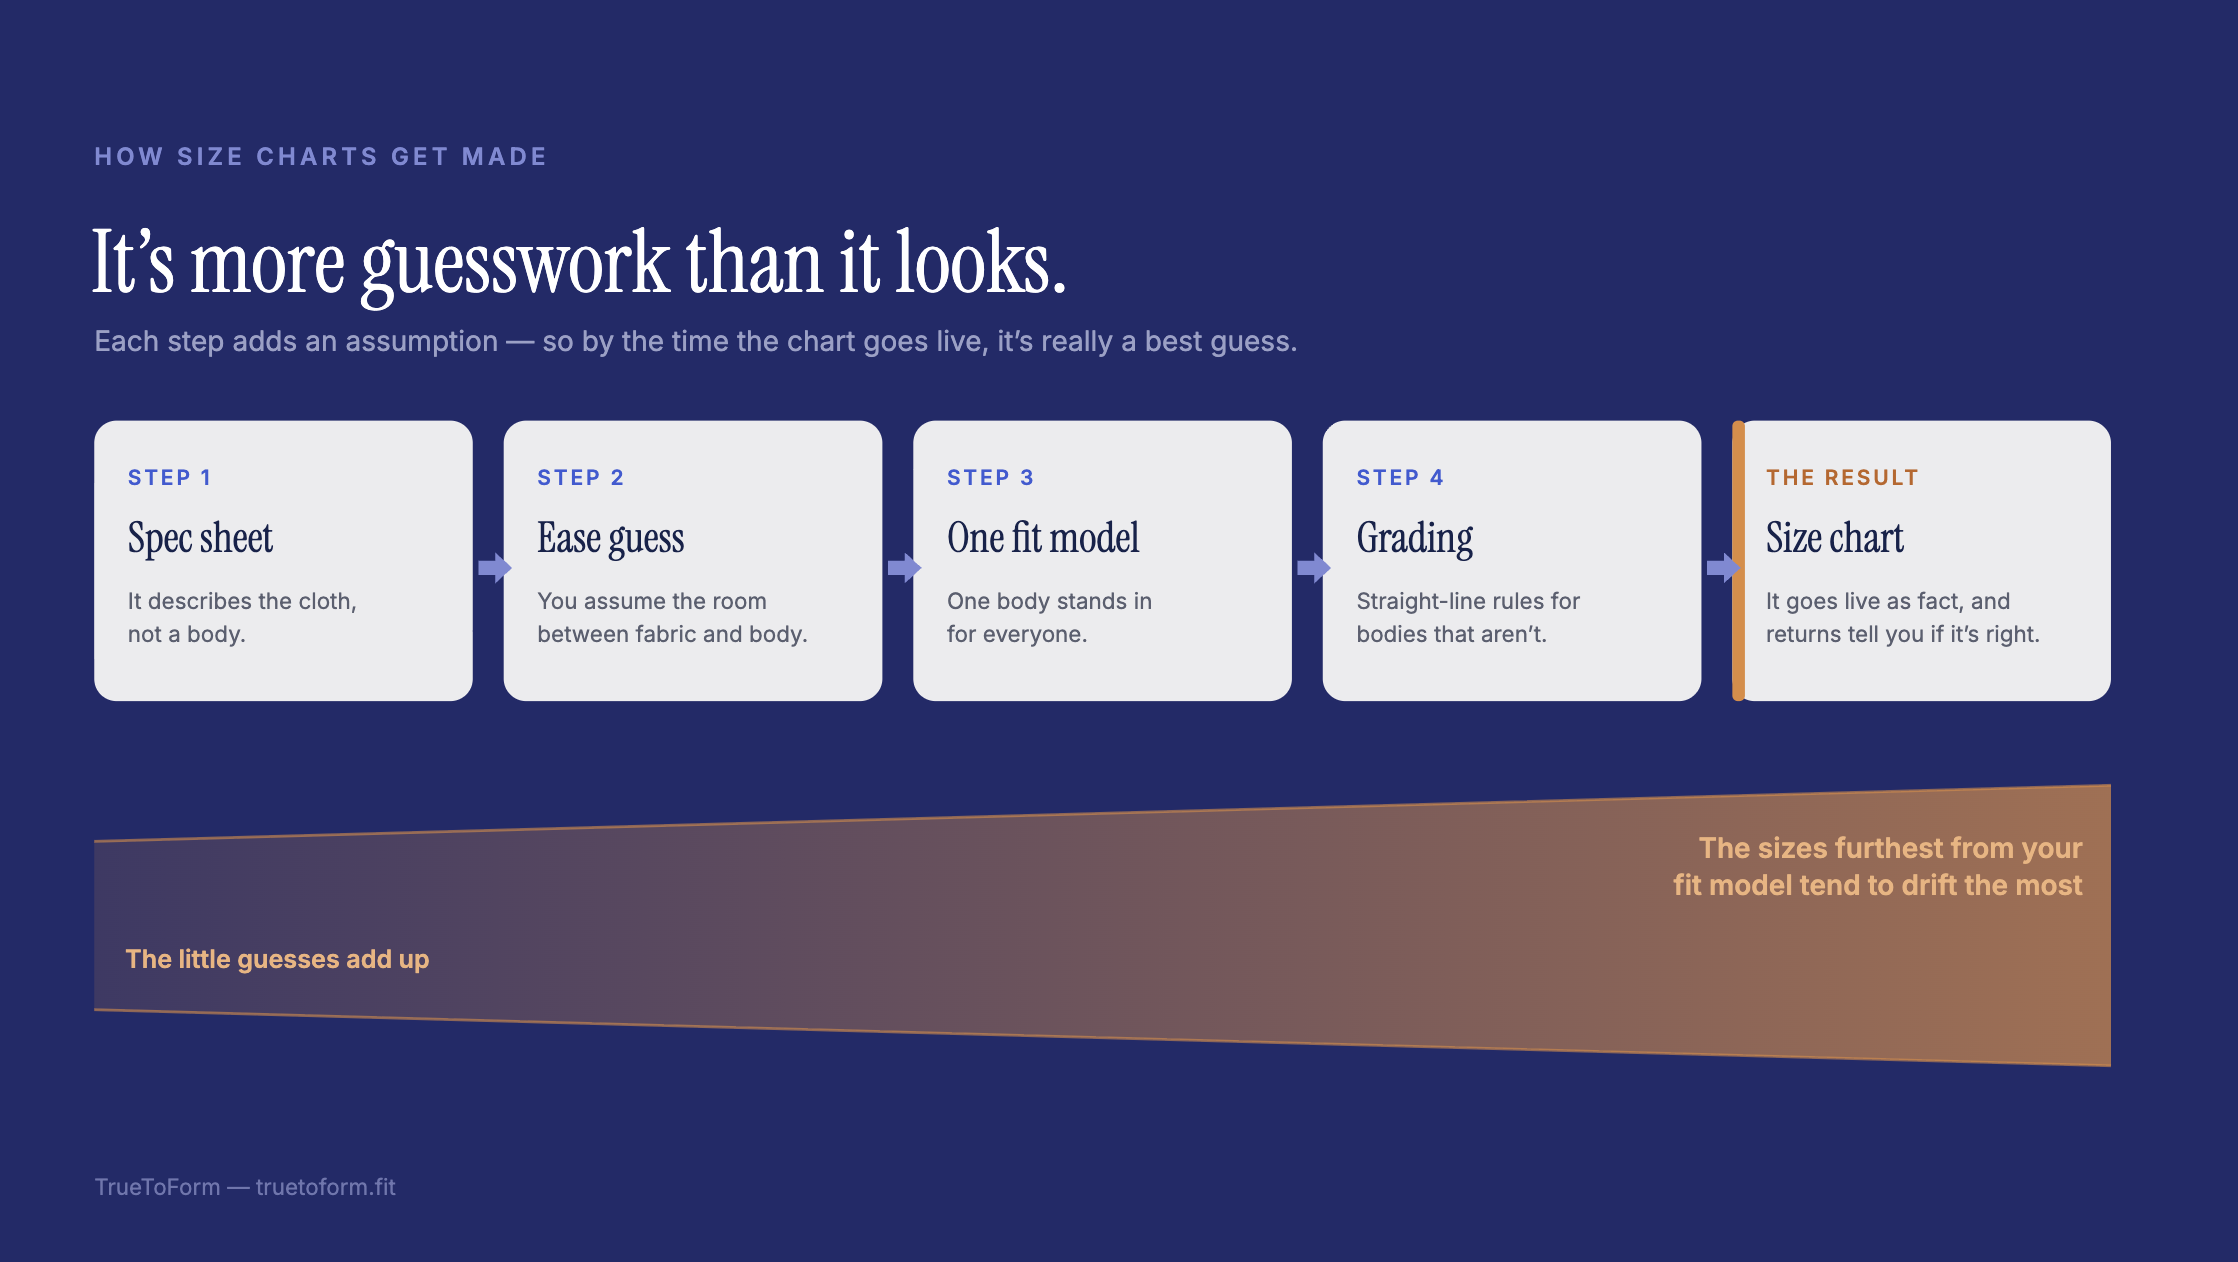
This is how size charts are made today. And once you follow the process end to end, it’s pretty clear why fit-related returns remain such a persistent challenge.
If you want to understand why size charts miss, follow the chain backward from the number on the page.
It starts with a spec sheet. Spec sheets describe the garment - points of measure, finished dimensions, tolerances. They describe cloth, not people. To turn a spec sheet into a body measurement size chart, you have to add an assumption about ease (i.e. how much room sits between the fabric and the customer) and you need a real human to anchor the base size.
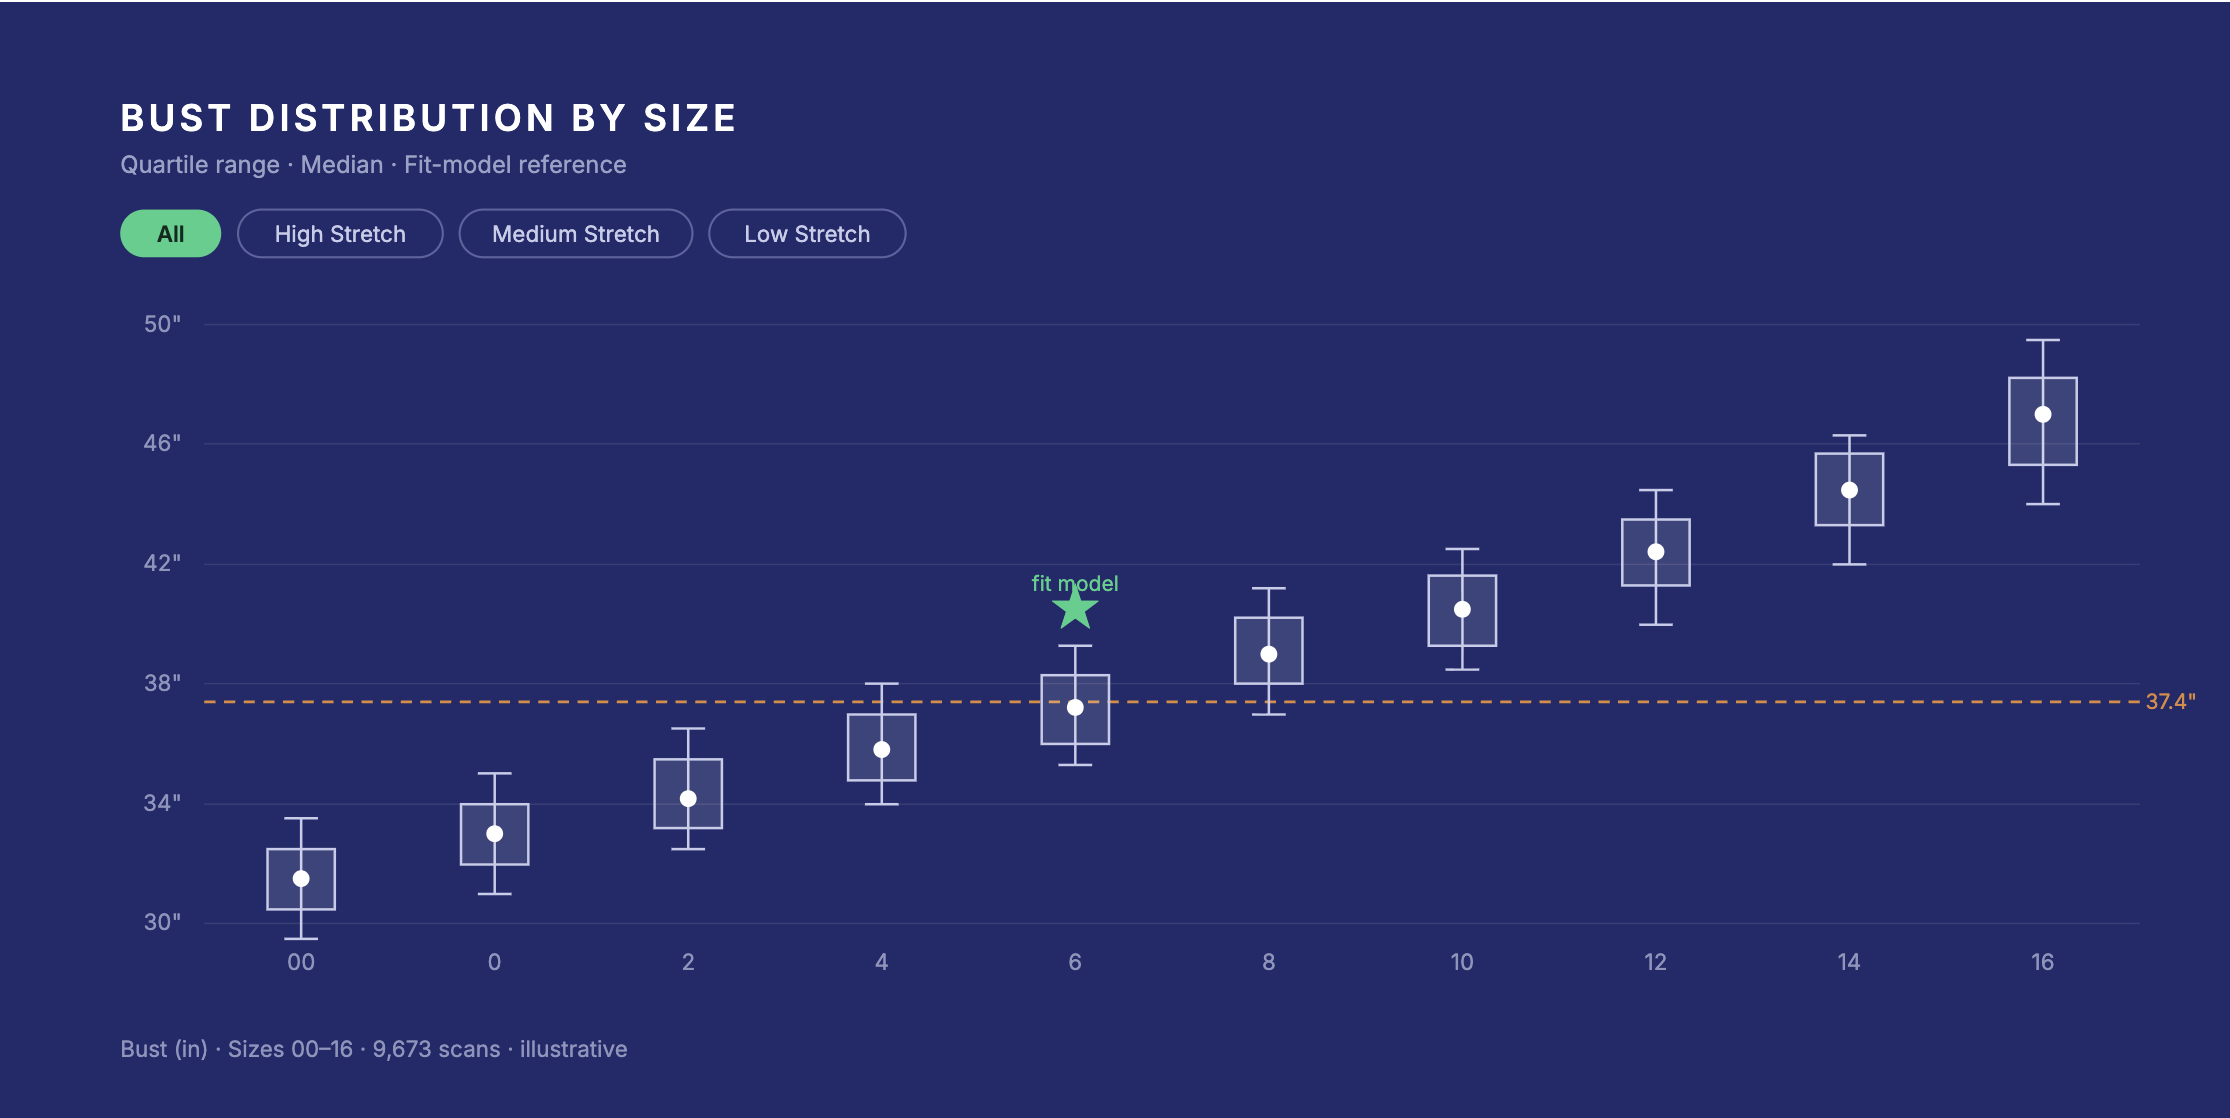
That human is your fit model. Here's the first leap of faith built into every size chart: you are betting that one person's proportions stand in for your entire target customer at the base size. Fit models get chosen for being "standard," but standard is often much harder to define than brands would like. Customer populations are rarely as uniform as sizing systems assume. Maybe your fit model's waist runs a couple inches under your real buyer's. Maybe her waist-to-hip ratio looks nothing like the median of the people actually checking out. Most of the time you have no way to know, because the only body in the fitting room is hers - and the thousands of bodies that pay you haven't shown up yet.
Then comes grading. To produce every size above and below the base, you step fixed increments up and down from that single anchor using grading rules. General grading assumes bodies scale uniformly - that the jump from S to M is proportionally identical to the jump from L to XL, and that every dimension grows in lockstep. Bodies don't work that way. Waist and hip don't grade at the same rate across a run. The customer at the top of your range is not a scaled-up photocopy of the one at the bottom. So the further a size sits from your fit model, the more it relies on assumptions that may or may not reflect the customers actually buying that size.
Put it together and a typical size chart is one body, one ease assumption, and a set of straight-line rules applied to non-linear humans. Then it's published as the best representation of who each size is intended to fit. Customers trust it. And when there's a mismatch, they tell you the only way the process allows: they send the box back.
When a fit-driven category posts a high return rate and the reason codes cluster around fit, that's often a sign that there's a gap between how the garment was intended to fit and how customers are actually experiencing it.
Your customers are continuously generating fit feedback through every purchase, return, and exchange. The challenge is that most brands never capture the one thing that would help explain those outcomes: what those customers measure.
That's the real waste. Every order is a body interacting with your garment. Most brands throw that signal straight in the trash.
A customer buys a size, tries it on, and decides whether it worked. The outcome gets recorded. The measurements behind the outcome usually don't.
Dynamic sizing is the idea that the people most qualified to define your size chart are the customers who already bought a size and kept it. So instead of treating the chart as a static document you revise once a season, you let it rebuild itself from real outcomes.
At TrueToForm, that's exactly what we do. We collect measurement data with every order and feed it back to the brand. Each purchase becomes a data point instead of a guess. That does two things.
Instead of designing around a single fit model and hoping she represents your customer, you can see the actual measurement distribution of the people buying and keeping each size. This doesn't mean re-cutting your garments. It simply gives your technical designers and fit teams better data to inform the decisions they're already making. Rather than relying on a single anchor point, you're looking at the real range of body measurements within each size.
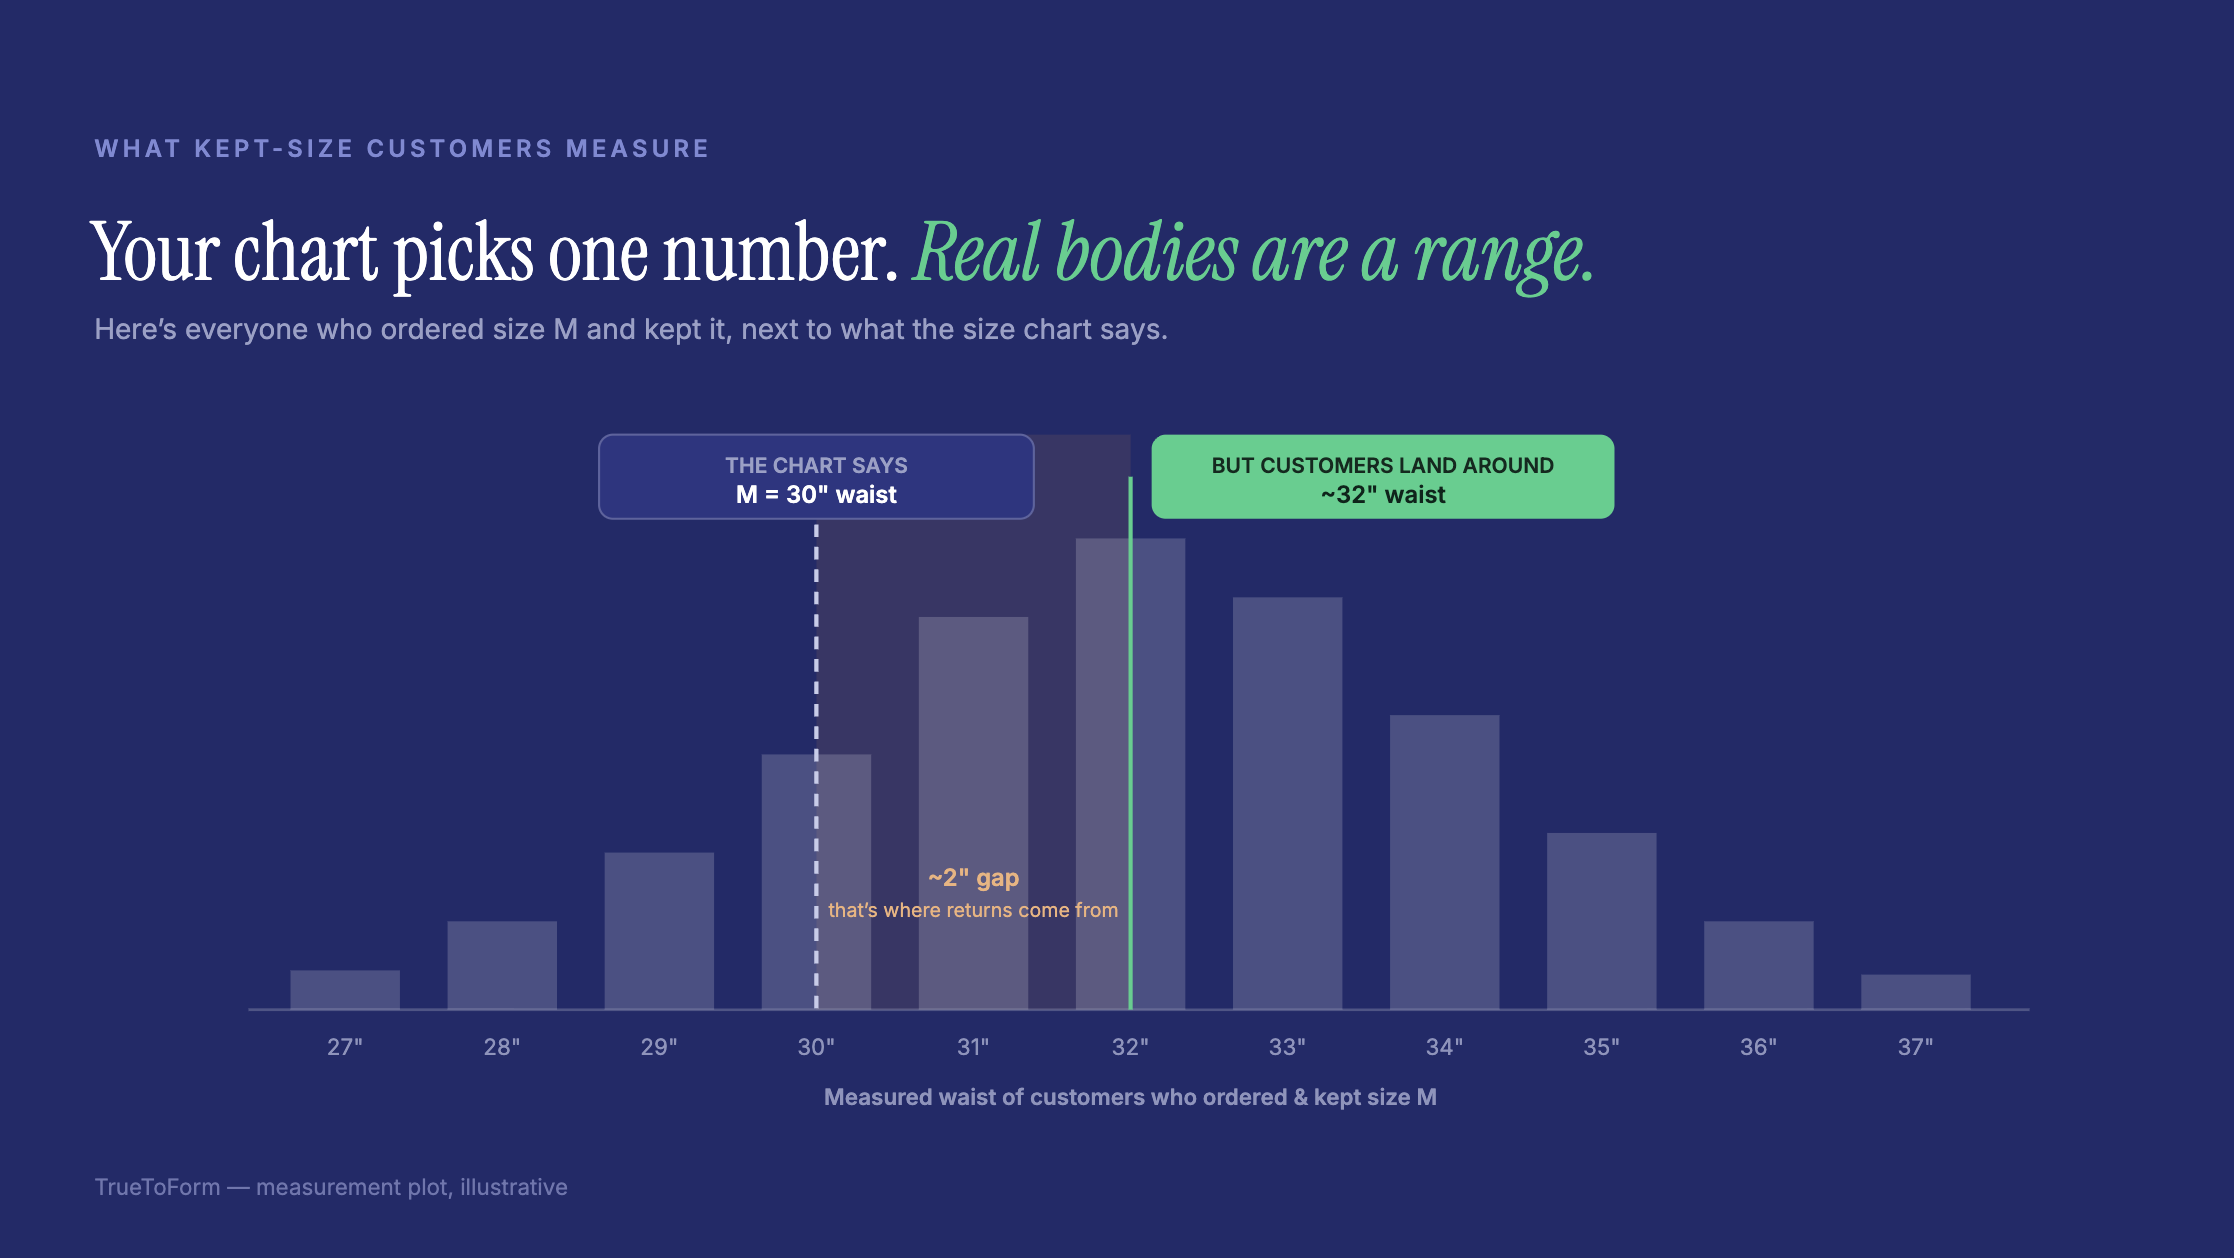
We turn that data into measurement plots that overlay your size chart against the measurements of customers who purchased and kept each size. The gaps become immediately obvious. For example, if your size chart says a Medium is designed for a 30-inch waist, but most customers successfully keeping a Medium measure closer to 32 inches, you're no longer debating assumptions, you're looking at actual customer behavior.
This is the part that changes the math. We discard returns and rebuild from the bodies that actually kept each size, so the chart converges on the reality of who wears what. As more orders come in, two things sharpen at once: the fit recommendations inside the tool get more accurate, and the static size chart link on your product page - the one plenty of shoppers click and eyeball before they ever touch a fit finder - starts serving measurement-backed numbers instead of relying entirely on the assumptions made before launch.
That second audience matters more than people think. A lot of shoppers never open a fit widget. They glance at the size chart and decide. Historically, those shoppers were relying on information created before real customer data existed. With dynamic sizing, the chart they glance at is increasingly informed by the customers who bought that size and were happy enough to keep it.
The model starts broad and narrows as your data grows. Early on, it builds from your existing internal data and fit-model measurements so you can go live. As orders accumulate, the chart sharpens, moving from general baselines toward charts tuned to specific categories and products.
That matters because fit isn't uniform across a catalog. A high-stretch garment behaves nothing like a structured woven; the amount of give in the fabric changes which body a given size actually serves. Segmenting measurement data by fabric and stretch lets the chart for your stretch bottoms diverge from the chart for your tailored pieces, instead of forcing both under one set of numbers that fits neither well.
You can capture preference too. Two customers with identical measurements can want different things, one snug and one with room. Because the data reflects what people chose and kept, it starts to encode preference alongside proportion - something a static chart structurally can't hold.
The old model: build a chart from one body and a ruler, publish it, and let returns tell you where the gaps are.
The new model: let every kept order refine the chart, so the numbers your customers see - and the recommendations they get - become more accurate the longer you run.
Your size chart will always start as a hypothesis. The only question is whether it stays one.
Everything above is about making the data honest. The other half is making that honesty visible to the one person who actually has to decide - the shopper.
So instead of pointing customers at a chart and asking them to translate numbers into their own body, we show them how a specific garment fits on their own 3D body shape before they buy. The dynamic size chart keeps the underlying measurements true; the 3D fit prediction puts that truth on the product page, where the buying decision happens.
Most sizing tools tell shoppers what to buy. We show them how it fits.
Size charts are derived from a garment spec sheet plus a single fit model, then extended to every other size with generic grading rules. Because they're anchored to one body and assume bodies scale linearly, they rarely match the real range of customers buying each size - which is why fit-related returns stay high even when the chart is carefully made.
A dynamic size chart is a size chart that updates itself using real customer measurement data. Instead of being fixed once per season, it continuously rebuilds from the measurements of customers who ordered and kept each size, so both the published chart and any fit recommendations get more accurate over time.
It replaces guesswork with outcomes. By learning from the bodies that actually kept each size — and discarding returns — the size chart and fit recommendations converge on who really wears what. Shoppers get numbers that reflect customers like them, which means fewer size-driven mistakes at checkout and fewer fit-related returns.
A fit model represents one body. Your customers are a distribution of bodies with different waist-to-hip ratios, proportions, and fit preferences, and they don't necessarily grade in a straight line from your base size. Fit models remain an important part of product development, but they can't capture the full range of customers who will ultimately buy the product.
Yes. Measurement data can be segmented by fabric content and stretch level, so high-stretch products can develop their own dynamic chart separate from structured wovens. That allows each category to reflect how its fabric actually fits real customers, rather than averaging everything into a single sizing model.
TrueToForm captures customer measurements as part of the ordering experience and feeds that data back to the brand. The brand can use it directly for fittings and design, and the system uses the measurements from kept orders to keep the size chart and fit recommendations accurate over time.
-
TrueToForm replaces static size charts with personalized fit and a size chart that learns. Want to see your own chart plotted against the measurements of customers who ordered and kept each size? That's the visibility we built TrueToForm to provide.
Subscribe to our mailing list for news and updates
Access on mobile at web.truetoform.fit (no install required).
Also available on the App Store.